Expert Tools for Serious Traders
Chat with analyst
Demo only. More content is available in Live mode.

2019-03-04 17:46

GBP/JPY

Hello Sir/Madam. Is there any scheduled news which possibly cause a big movement to GBP/JPY in March?

I was wondering what news I should carefully follow this month.
Claws&Horns TeamClaws&Horns Team, Analyst
Hello. Well, obviously, the main event in March that will affect the market and GBP in particular is Brexit. On 12th of March there will be the final vote on the deal between EU and UK. The UK is currently scheduled to leave the European Union on 29 March. Meanwhile, this week you should pay attention to the Japan's GDP statistics on Friday which may put pressure on JPY.

2018-10-23 16:48

AUD/USD

Hello I would like to ask what is the meaning of this MA10 MA20 MA50 MA100 MACD BBands Ichimoku Stochastic William`s ZigZag
Claws&Horns TeamClaws&Horns Team, Analyst
MA, MACD, BBands, Ichimoku, Stochastic, William`s and ZigZag are the most popular technical indicators that give their readings in the form of signals.
The signals are the interpretation of the technical indicators embedded in the Meta Trader platform. For different time intervals (time frames), technical indicators can give different trading signals. Dotted arrows of green, red or black colors indicate the direction of price movement, which is indicated by a technical indicator on a specific time frame. The number of dotted arrows indicates the degree of signal strength. Three arrows mean the maximum signal level. An arrow pointing sideways means no pronounced signal.

2018-08-13 09:49

USD/TRY

what is the view on tryusd ?
Claws&Horns TeamClaws&Horns Team, Analyst
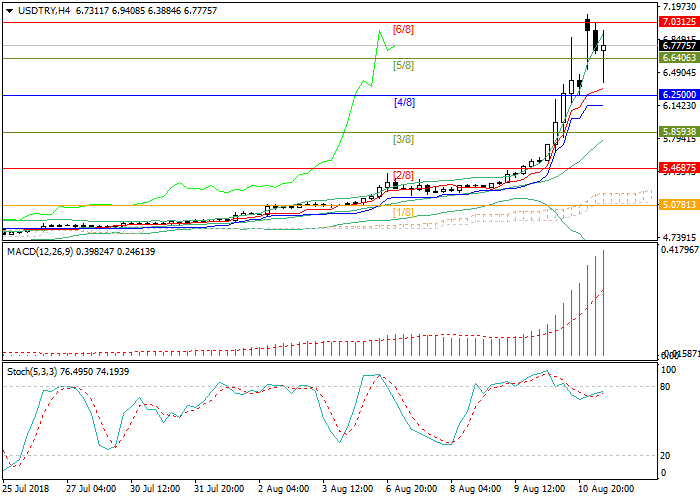
The Turkish lira continues to fall against the US dollar due to the financial crisis in Turkey, connected with the introduction of the US increased duties on imported aluminium and steel from Turkey. As a result, the Turkish lira fell to historic lows. Despite a small downward correction, which was caused by the introduction of limits on foreign exchange operations with foreign counterparties (operations should not exceed 50% of the bank's capital), the tendency to the growth of the USD/TRY rate is still strong, which is confirmed by technical indicators. The Bollinger bands diverge, reflecting the active development of the current upward trend. MACD is growing in the positive zone, forming a buy signal. Stochastics lines are directed upwards.
The next target for long positions will be the level of 7.2941 (Murray [7/8]). This scenario will be possible if the rate consolidates above the level of 7.0312 (Murray [6/8]).
The downward correction will be possible below the level of 6.6400. In this case, the decline will continue to the level of 6.2500 (Murray [4/8]), where a strong support zone is located.

Attached files:

2017-10-02 10:43

USD/JPY

Hi sir, Is USD/JPY is possible to buy now ?
Claws&Horns TeamClaws&Horns Team, Analyst
In general, technical indicators reflex the maintenance of the growth potential, but it’s better to wait until the market reacts to the level of 113.24. The steady breakout and consolidation of the price above this level will let the pair grow to the area of 113.96.
If the price cannot break the level of 113.24, the downward correction will form with the target at the level of 112.26.

2016-04-22 10:02

EUR/USD

is it right time to buy ERU/USD ?Is this pair will up?
Claws&Horns TeamClaws&Horns Team, Analyst
On the 4-hour chart, technical indicators suggest a downward development. MACD histogram is in the negative zone and its volumes are growing thus forming a sell signal. Bollinger Bands are directed down suggesting a fall continuation as well. The pair was pressured by today’s data on Markit Services and Manufacturing PMI’s form the eurozone that came out worse than forecasts. A growth continuation would be possible after a breakout and consolidation above the level of 1.1333. In this case, its next targets could be at 1.1385 and 1.1434. Short positions can be opened after the price consolidation below the level of 1.1259 with the target in the region of 1.1187.

2016-04-22 01:27

GBP/USD

What are the number you use for MACD setting and how do i use it to determine up or down trend for all pairs and daily timeframe?
Claws&Horns TeamClaws&Horns Team, Analyst
We choose default settings for MACD indicator (12, 26, 9). No matter which pair or what timeframe MACD gives signals of trend reversal anyway. When signal line leaves histogram zone below zero line, it is the sign of trend turning up. When signal line leaves histogram zone above zero line, it is the sign of trend turning down. When histogram crosses the zero line this is a strong confirmation of either downward or upward trend.

2016-04-21 12:37

EUR/USD

During eur intrest fate decsion if rates unchanged eurusd will go down can i take sell ?
Claws&Horns TeamClaws&Horns Team, Analyst
The ECB will probably keep the interest rate unchanged so the decision itself is unlikely to lead to a growth or a fall in the Euro.
Closer attention is paid to ECB President Draghi speech. His comments could lead to an increase in volatility on the market. Markets expect that Draghi will continue with monetary policy easing, and that could pressure the Euro. Otherwise, the Euro could keep growing.
Today attention also should to be paid to data on Initial Jobless Claims in the US, which is due at 2:30 pm (GMT+2).

2016-04-20 02:45

USD/CAD

Hello,
Do you analysis daily tmeiframe chart?
Claws&Horns TeamClaws&Horns Team, Analyst
On the daily chart, the USD/CAD pair remains in a downward trend.
Technical indicators suggest there is yet more growth potential for the CAD.
MACD histogram is in the negative zone and its volumes are growing, indicating a fall continuation. Bollinger Bands are directed down also suggesting the trend will continue. However, the price broke down the lower MA of the indicator thus pointing out to the possibility of an upward correction towards the middle MA, near the level of 1.2975.
The fall will likely continue after a breakdown and consolidation below the level of 1.2630. The price will then decline towards 1.2537 and 1.2436.
A trend reverse could be viable after a price consolidation above the level of 1.2990. The pair could then grow towards next resistance levels in the region of 1.3155 and 1.3219.

2016-04-17 14:39

EUR/USD

can eurusd go down side again...
Claws&Horns TeamClaws&Horns Team, Analyst
On the daily chart, MACD histogram is in the positive zone but its volumes are falling thus signalling a downward movement. Bollinger Bands are directed sideways indicating a flat in the pair.
In the absence of important news on the market, its participants are not in hurry to open large positions. The most important even is due on Thursday at 1:45 pm (GMT2+), the ECB meeting.
The likeliest short-term scenario is pair’s movement in the range, between the levels of 1.1232 and 1.1339.

2016-04-12 15:52

EUR/USD

Hello
On the hour frame the candle that make big tail mean that the eurusd lose his strong and will begain to fall and change his direction?
Claws&Horns TeamClaws&Horns Team, Analyst
Hello.
According to candlestick analysis, the candle on the chart indicates an “inverted hammer”. The inverted hammer signals an end to the upward movement and the beginning of the fall. In this case the reverse is confirmed by the formation “evening star”. The likeliest scenario for the short-term is pair’s fall to the level of 1.1336. A breakdown of the level of 1.1336 would open the way towards 1.1307 and 1.1281.
MACD histogram is in the negative zone and its volumes are growing that signals a fall continuation. Bollinger Bands are expanding suggesting the current tendency will continue.

Attached files: