Expert Tools for Serious Traders
Chat with analyst
Demo only. More content is available in Live mode.

2016-04-10 20:36

EUR/USD

What is your opinion on the EUR/USD in the long term? Are we to further expect an uptrend or down trend in the envisaged future?
Claws&Horns TeamClaws&Horns Team, Analyst
Since the end of March, the EUR/USD pair has been trading sideways. Such dynamics was determined by mixed macroeconomic data, released both in the US and the eurozone.
In the second half of the week, the publication of a series of important indicators can influence future trend in the pair. Market participant will be following data on industrial production and consumer price index, due in the EU, and data on retail sales, inflation and labour market, due the US.
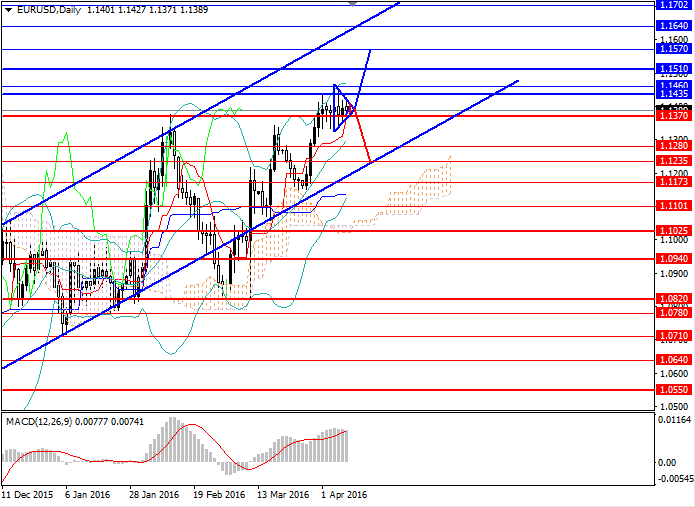
A sideways triangle pattern has formed on the chart, and strong price movement should be expected amid the publication of macroeconomic statistics. Therefore, the price is likely to continue trading sideways for a couple of days and then either grow to the key resistance of 1.1570 or fall to the strong support of 1.1235.

Attached files:

2016-04-10 01:16

USCrude

Hi, Can you tell about the US crude oil analysis pls
Claws&Horns TeamClaws&Horns Team, Analyst
On the daily chart, the instrument is correcting down from the upper MA of Bollinger Bands. The price remains above its moving averages that start turning up. The RSI failed its descending trendline and turned down. The Composite is testing its March resistance.
On the 4-hour chart, the instrument is falling from the upper MA of Bollinger Bands. The price remains above its moving averages that are directed up. The RSI turned down as it failed its March resistance. The Composite has formed a divergence with the price and RSI suggesting a fall possibility.
Support levels: 40.97 (local lows), 39.78 (active trade), 38.28 (March lows).
Resistance levels: 42.48 (March highs), 43.34 (November 2015 lows), 46.25 (September and October 2015 lows).
Short positions can be opened from the level of 40.92 with the target at 39.88 and stop-loss at 41.38. Validity – 2-3 days.
Long positions can be opened from the level of 42.50 with targets at 43.30, 46.05 and stop-loss at 41.95. Validity – 2-4 days.

Attached files: