Expert Tools for Serious Traders
Chat with analyst
Demo only. More content is available in Live mode.

2016-04-21 12:37

EUR/USD

During eur intrest fate decsion if rates unchanged eurusd will go down can i take sell ?
Claws&Horns TeamClaws&Horns Team, Analyst
The ECB will probably keep the interest rate unchanged so the decision itself is unlikely to lead to a growth or a fall in the Euro.
Closer attention is paid to ECB President Draghi speech. His comments could lead to an increase in volatility on the market. Markets expect that Draghi will continue with monetary policy easing, and that could pressure the Euro. Otherwise, the Euro could keep growing.
Today attention also should to be paid to data on Initial Jobless Claims in the US, which is due at 2:30 pm (GMT+2).
2016-04-20 02:45

USD/CAD

Hello,
Do you analysis daily tmeiframe chart?
Claws&Horns TeamClaws&Horns Team, Analyst
On the daily chart, the USD/CAD pair remains in a downward trend.
Technical indicators suggest there is yet more growth potential for the CAD.
MACD histogram is in the negative zone and its volumes are growing, indicating a fall continuation. Bollinger Bands are directed down also suggesting the trend will continue. However, the price broke down the lower MA of the indicator thus pointing out to the possibility of an upward correction towards the middle MA, near the level of 1.2975.
The fall will likely continue after a breakdown and consolidation below the level of 1.2630. The price will then decline towards 1.2537 and 1.2436.
A trend reverse could be viable after a price consolidation above the level of 1.2990. The pair could then grow towards next resistance levels in the region of 1.3155 and 1.3219.

2016-04-17 14:39

EUR/USD

can eurusd go down side again...
Claws&Horns TeamClaws&Horns Team, Analyst
On the daily chart, MACD histogram is in the positive zone but its volumes are falling thus signalling a downward movement. Bollinger Bands are directed sideways indicating a flat in the pair.
In the absence of important news on the market, its participants are not in hurry to open large positions. The most important even is due on Thursday at 1:45 pm (GMT2+), the ECB meeting.
The likeliest short-term scenario is pair’s movement in the range, between the levels of 1.1232 and 1.1339.

2016-04-13 07:04

USD/JPY

Please let me know, what is the condition about usd/jpy?? for weekly/daily?
Claws&Horns TeamClaws&Horns Team, Analyst
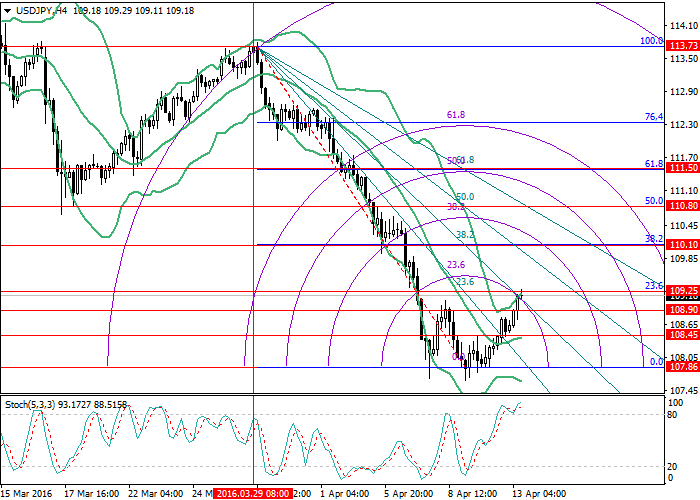
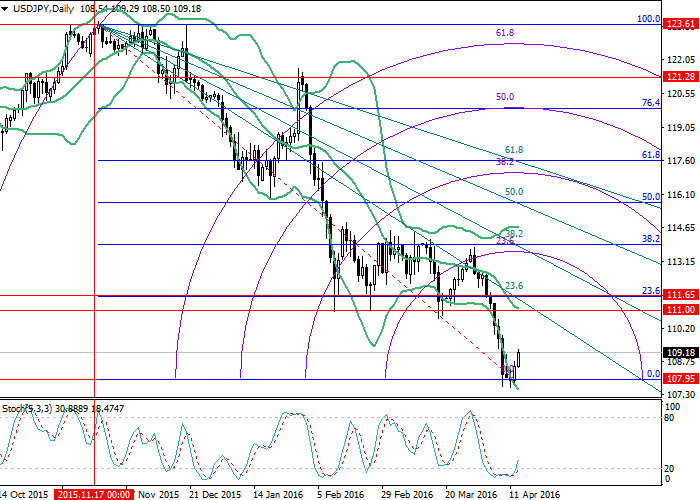
Hello. At present, the pair is correcting. The price is testing the key resistance at 109.25 a breakout of which can lead to a growth towards 110.10, 110.80 and, possibly, 111.50. A rebound down would result in a fall towards 108.45 (middle MA of Bollinger Bands) and 107.86. The pair growth is a likelier scenario, in the long term in particular, that is indicated by Stochastic on the daily chart. Out of fundamental statistics this week, attention needs to be paid to data on Industrial Production, due in the US and Japan. The forecast for the US economy is more favorable suggesting the USD tends to strengthen.

Attached files:

2016-04-12 15:52

EUR/USD

Hello
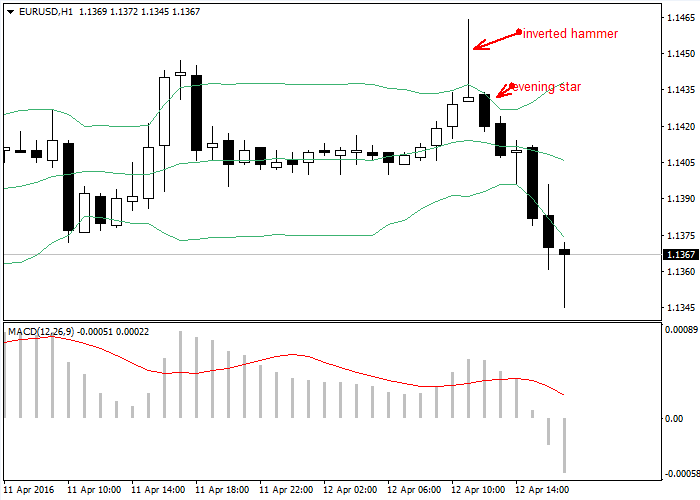
On the hour frame the candle that make big tail mean that the eurusd lose his strong and will begain to fall and change his direction?
Claws&Horns TeamClaws&Horns Team, Analyst
Hello.
According to candlestick analysis, the candle on the chart indicates an “inverted hammer”. The inverted hammer signals an end to the upward movement and the beginning of the fall. In this case the reverse is confirmed by the formation “evening star”. The likeliest scenario for the short-term is pair’s fall to the level of 1.1336. A breakdown of the level of 1.1336 would open the way towards 1.1307 and 1.1281.
MACD histogram is in the negative zone and its volumes are growing that signals a fall continuation. Bollinger Bands are expanding suggesting the current tendency will continue.

Attached files:

2016-04-10 20:36

EUR/USD

What is your opinion on the EUR/USD in the long term? Are we to further expect an uptrend or down trend in the envisaged future?
Claws&Horns TeamClaws&Horns Team, Analyst
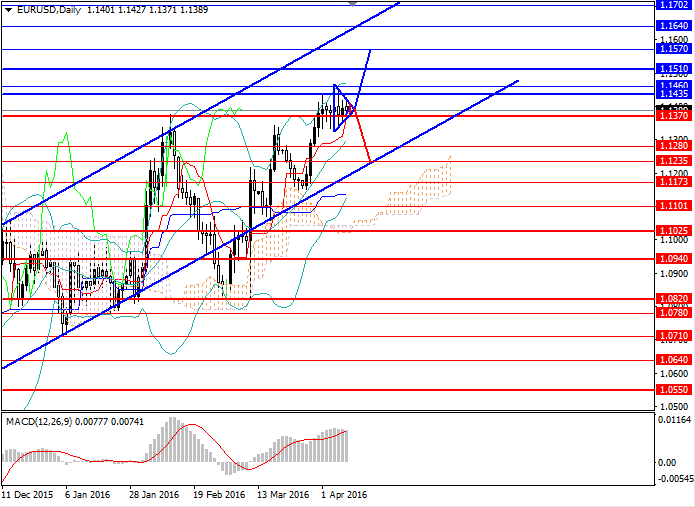
Since the end of March, the EUR/USD pair has been trading sideways. Such dynamics was determined by mixed macroeconomic data, released both in the US and the eurozone.
In the second half of the week, the publication of a series of important indicators can influence future trend in the pair. Market participant will be following data on industrial production and consumer price index, due in the EU, and data on retail sales, inflation and labour market, due the US.
A sideways triangle pattern has formed on the chart, and strong price movement should be expected amid the publication of macroeconomic statistics. Therefore, the price is likely to continue trading sideways for a couple of days and then either grow to the key resistance of 1.1570 or fall to the strong support of 1.1235.

Attached files:

2016-04-10 01:16

USCrude

Hi, Can you tell about the US crude oil analysis pls
Claws&Horns TeamClaws&Horns Team, Analyst
On the daily chart, the instrument is correcting down from the upper MA of Bollinger Bands. The price remains above its moving averages that start turning up. The RSI failed its descending trendline and turned down. The Composite is testing its March resistance.
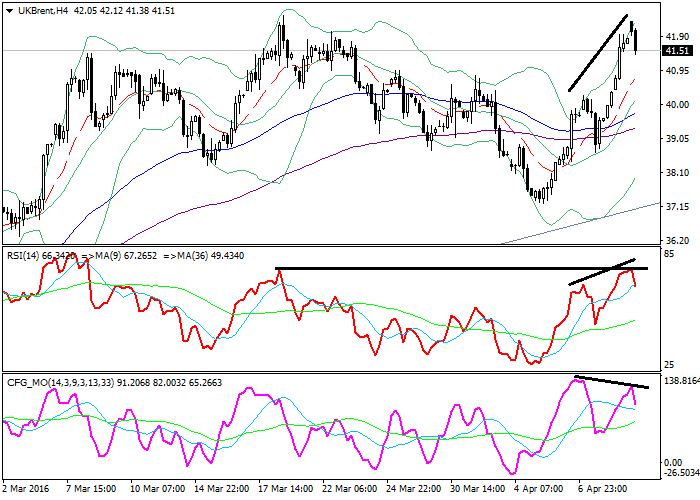
On the 4-hour chart, the instrument is falling from the upper MA of Bollinger Bands. The price remains above its moving averages that are directed up. The RSI turned down as it failed its March resistance. The Composite has formed a divergence with the price and RSI suggesting a fall possibility.
Support levels: 40.97 (local lows), 39.78 (active trade), 38.28 (March lows).
Resistance levels: 42.48 (March highs), 43.34 (November 2015 lows), 46.25 (September and October 2015 lows).
Short positions can be opened from the level of 40.92 with the target at 39.88 and stop-loss at 41.38. Validity – 2-3 days.
Long positions can be opened from the level of 42.50 with targets at 43.30, 46.05 and stop-loss at 41.95. Validity – 2-4 days.

Attached files:

2015-06-12 17:24

EUR/USD

I would like to know where the EUR USD will go till the end of the week?
Claws&Horns TeamClaws&Horns Team, Analyst
Last week EUR/USD has reached the level of 1.1380, but then has been corrected to the middle MA of BB at 1.1140. The breakout of this level will allow the pair to go further down to the levels of 1.1000, 1.0850. Otherwise the price can return to the levels of 1.1380 and 1.1500.
Technical indicators are neutral. BB are directed horizontal. MACD histogram is at the zero line with almost no volumes. Stochastic lines have crossed and turned downwards.
This week the market will be affected by another FRS meeting, where the change of interest rate may or may no t be announced. The raise of the rates will most probably strengthen American currency. Moreover investors should pay attention to the May's CPI in US and eurozone as well as June’s ZEW indices.
It is recommended to open short trades below 1.1140 with targets at 1.1000 and 1.0850. Buy orders can be placed above 1.1250 with targets at 1.1380.

2014-11-20 09:28

EUR/USD

Hey for the trading signals, the time for that signal is based on GMT/EST etc?
Claws&Horns TeamClaws&Horns Team, Analyst
Trading signal based on technical indicators are refreshed every 2 hours from 10 to 18 GMT+2